
⚡ Quick Facts
Hidden motor failures cost manufacturers thousands in unexpected downtime — undetected winding defects are a leading cause of catastrophic motor failure. Waveform analysis in surge testing transforms invisible electrical signatures into diagnostic intelligence, revealing turn-to-turn faults, insulation weaknesses, and manufacturing defects before they escalate. This advanced technique empowers maintenance teams to predict failures, optimize quality control, and extend equipment lifespan through precision pattern recognition.
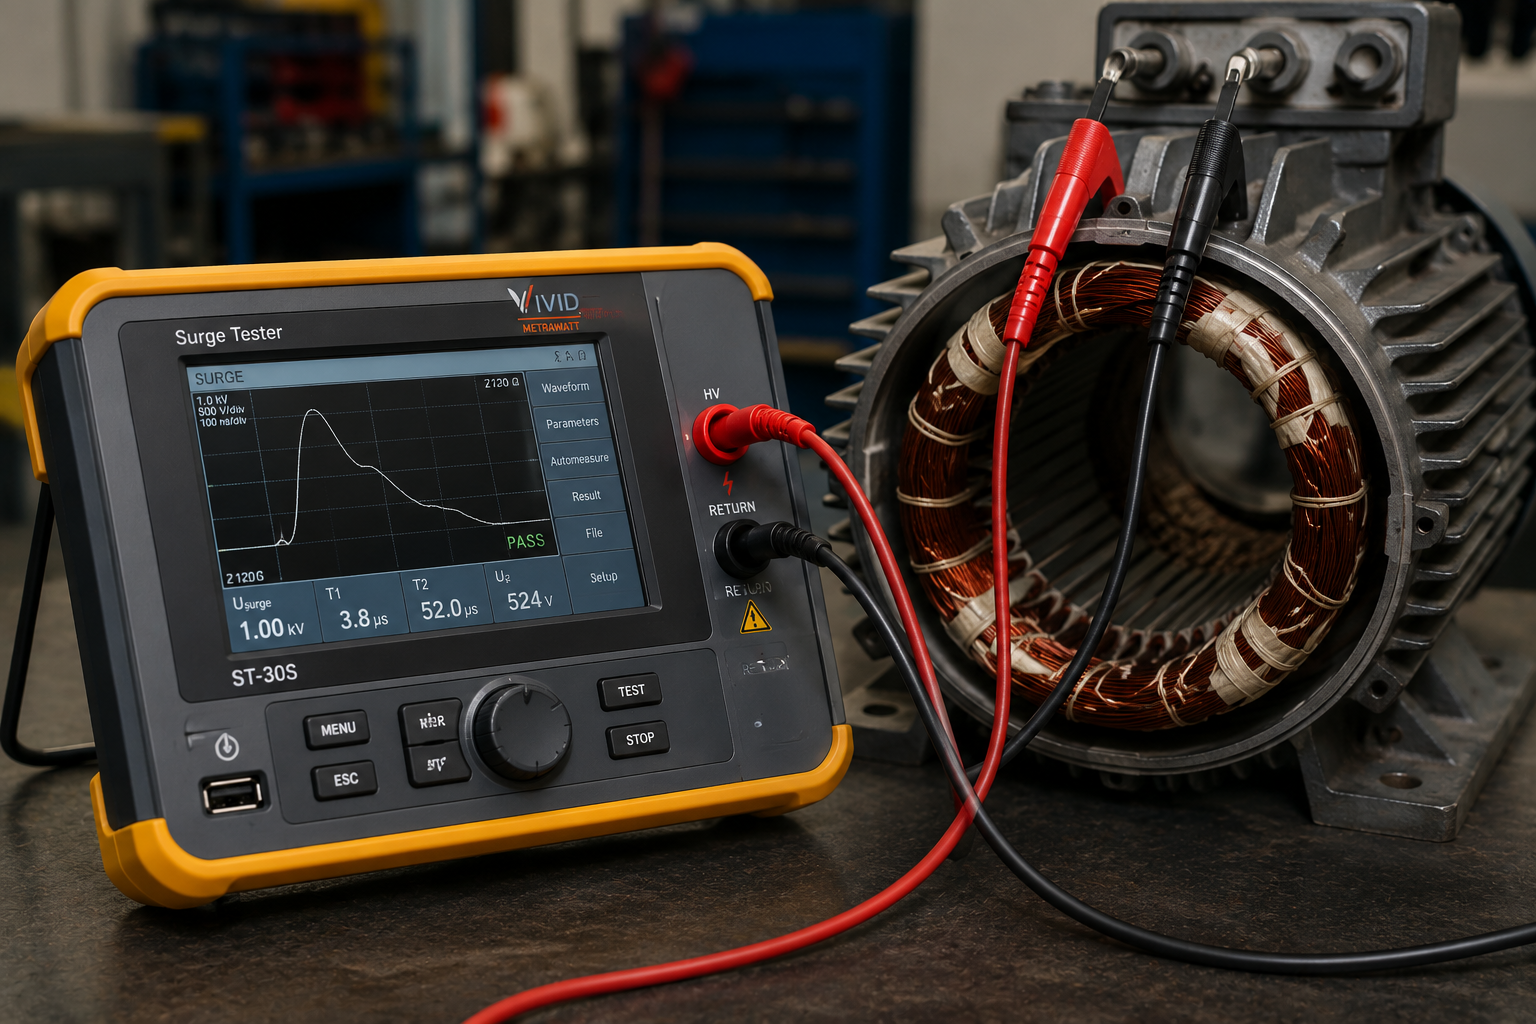
Waveform analysis represents the cornerstone of modern electrical diagnostics, transforming raw voltage patterns into actionable intelligence. When a surge tester applies a controlled high-voltage pulse to motor windings, the resulting electrical signature creates distinctive patterns that reveal the internal health of the component.
Every electrical component possesses unique impedance characteristics that influence how voltage propagates through its structure. During impulse testing, these characteristics manifest as:
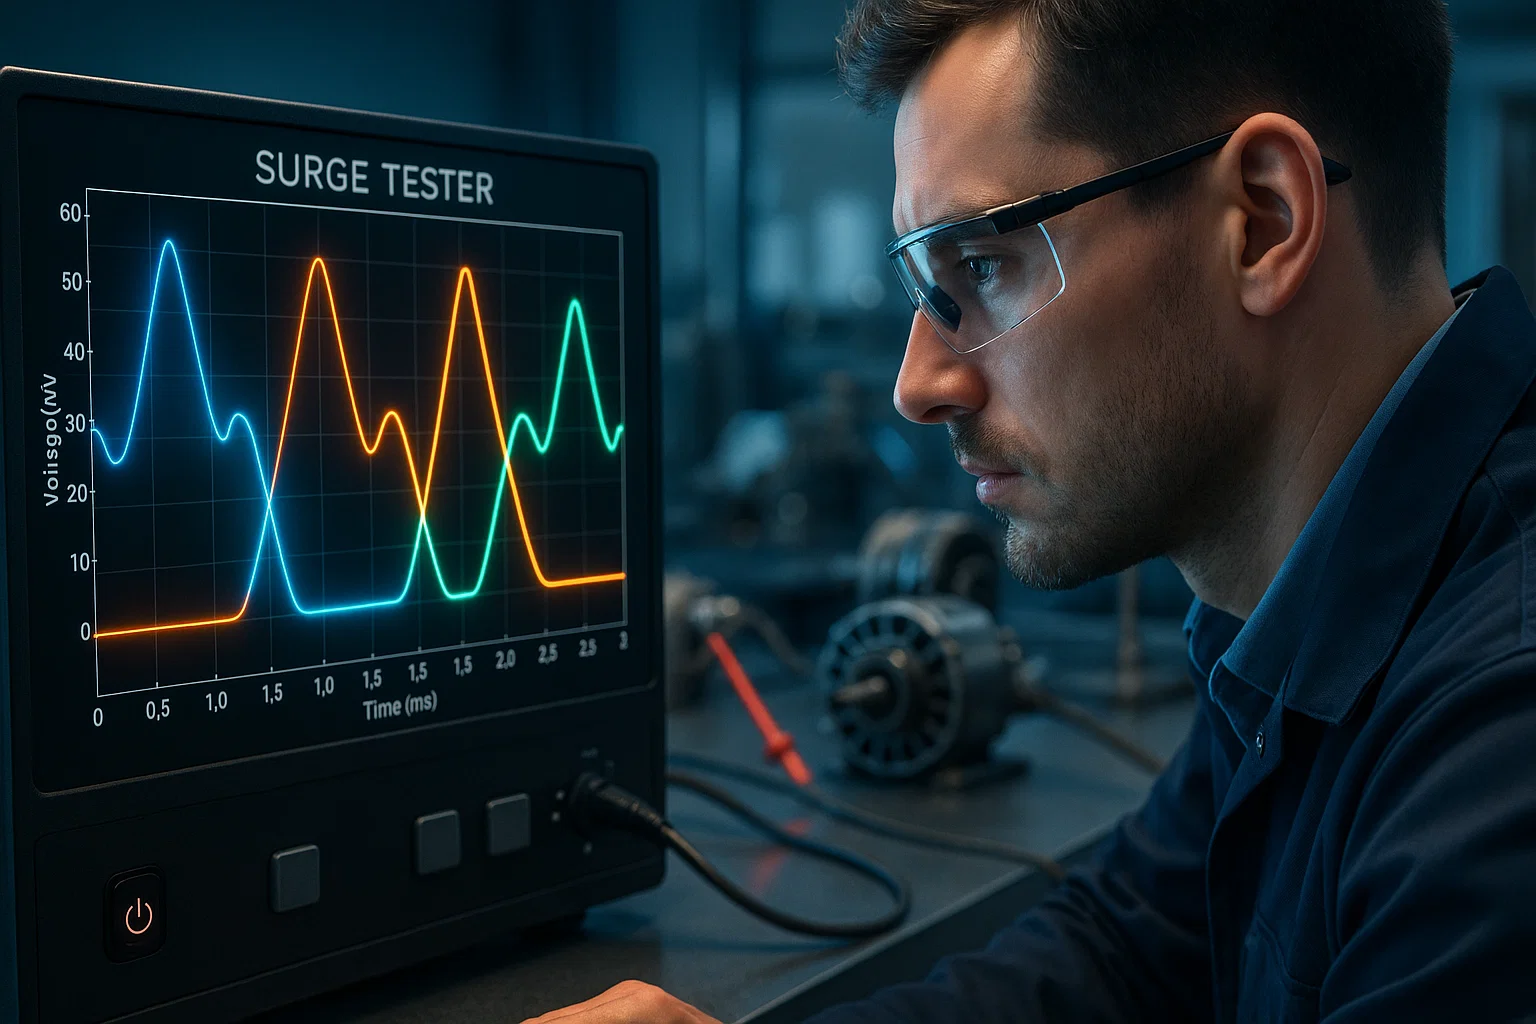
The visual representation of these parameters creates a diagnostic fingerprint that experienced technicians can interpret with remarkable precision. This electrical signature analysis has become a core tool in predictive maintenance strategies across industries — and pairs directly with a structured testing schedule; see Motor Insulation Testing Frequency: How Often Should You Test Your Motors? for interval guidance by motor criticality.
Traditional pass-fail testing provides binary results, but waveform analysis delivers nuanced insights. A motor might pass basic resistance measurements yet harbor turn-to-turn faults that only reveal themselves under surge conditions. The voltage waveform captures these subtle anomalies that conventional testing methods miss.
Understanding how surge generators work enhances your ability to interpret the resulting patterns. The controlled energy discharge creates a momentary stress condition that mimics years of operational wear, forcing latent defects to surface during testing rather than during critical operations.
The waveform analysis process follows a systematic approach that combines physics, electronics, and pattern recognition to deliver comprehensive diagnostic results.
When technicians initiate a surge test, the equipment executes a precisely orchestrated sequence:
This multi-stage approach ensures that even microscopic insulation defects don’t escape detection. The precision of modern digital armature surge testers has elevated waveform analysis from art to science. The quantified version of this comparison — expressed as a single objective number rather than a visual judgement call — is the Error Area Ratio (EAR), covered in detail in its own guide.
Raw electrical signals undergo sophisticated processing before presentation to the operator. Digital signal processing techniques filter noise, enhance relevant features, and overlay comparative data for intuitive interpretation. The display typically presents:
These visualization methods transform complex electrical phenomena into accessible diagnostic tools that don’t require advanced electrical engineering degrees to interpret.
Mastering waveform interpretation requires familiarity with common patterns and their diagnostic implications. Each signature tells a specific story about winding condition and potential failure modes.
A properly functioning motor winding produces a characteristic damped oscillation pattern with:
When testing motor windings, these baseline characteristics serve as the reference standard against which all subsequent measurements are compared.
Short circuits between adjacent turns create distinctive waveform distortions. The reduced inductance in the affected coil causes:
These patterns emerge clearly during phase comparison analysis, where overlaying traces from multiple windings reveals even subtle discrepancies.
Insulation breakdown between windings and the motor frame manifests as:
Detecting surge tester insulation failures early prevents catastrophic motor damage and extends operational lifespan significantly.
Broken conductor strands or poor connections create unique signatures characterized by:
These unmistakable patterns immediately alert operators to critical winding defects requiring immediate attention.
The adoption of waveform-based diagnostics delivers measurable advantages across quality control, maintenance, and operational efficiency domains.
Pattern recognition identifies nascent failures long before conventional testing methods register anomalies, including manufacturing defects before product shipment and intermittent failures that escape basic testing. This predictive capability transforms maintenance from reactive to proactive, scheduling repairs during planned downtime rather than emergency shutdowns.
Manufacturing facilities implementing waveform analysis report improvements in product consistency. The technique enables:
The benefits of using surge testers with advanced waveform capabilities extend far beyond simple pass-fail determinations.
Financial benefits materialize through multiple channels:
For high-voltage assets specifically, this predictive value compounds further — see How 50KV Surge Testers Reduce Motor Failures & Save Thousands in Downtime for the high-voltage motor case.
Industries subject to stringent quality standards leverage waveform documentation for:
Digital waveform records provide evidence of thorough testing protocols and quality assurance rigor.
Beyond basic pattern recognition, experienced diagnosticians identify subtle variations indicating specific failure mechanisms and root causes.
Voltage peak deviations signal multiple potential issues:
10–20% Reduction:
20–40% Reduction:
Greater than 40% Reduction:
When troubleshooting common surge tester errors, distinguishing between equipment artifacts and genuine winding issues becomes critical for accurate diagnosis.
The oscillation frequency relates directly to winding inductance and capacitance. Changes indicate:
Frequency Increase: reduced inductance from shorted turns, decreased effective winding length, turn-to-turn insulation failure
Frequency Decrease: increased capacitance from moisture ingress, insulation contamination, dielectric property degradation
Precise frequency measurement enables quantitative defect assessment, calculating the approximate number of affected turns based on percentage frequency deviation.
Overlay analysis of multiple winding waveforms reveals asymmetry issues invisible in individual traces:
This comparative approach dramatically improves detection sensitivity to deviations that might otherwise go unnoticed.
Sophisticated diagnostic applications employ enhanced analysis methods that extract additional intelligence from surge test data.
Frequency domain analysis decomposes complex waveforms into constituent frequency components, revealing:
FFT techniques prove particularly valuable when investigating intermittent failures or subtle degradation patterns.
Advanced systems calculate difference curves between test and reference waveforms, amplifying subtle anomalies. Benefits include:
Combining surge testing with reflectometry techniques pinpoints the physical location of defects within winding structures. The method:
This capability proves invaluable for large rotating machinery where selective coil replacement offers significant cost advantages over complete rewinding.
The applications of digital surge testers continue expanding as computational power enables increasingly sophisticated analysis algorithms.
Waveform analysis transcends traditional motor testing, finding applications across diverse industrial sectors and equipment types.
Production environments deploy inline surge testing with waveform analysis for:
Electric Motor Manufacturing: 100% production testing of stators and rotors, automated defect classification and sorting, statistical process control using waveform metrics, traceability documentation for warranty claims
Transformer Production: layer-to-layer insulation verification, winding symmetry confirmation, core lamination defect detection, final assembly validation
Service organizations integrate waveform trending into condition monitoring strategies:
Portable surge testers with waveform capabilities enable on-site troubleshooting: rapid fault isolation reducing service call duration, comparative analysis using factory baseline data, repair verification confirming restoration quality, and customer documentation providing visual proof of testing. Understanding how to test armature using a surge tester becomes essential for field technicians supporting diverse equipment populations.
Engineering teams leverage waveform analysis during product development: insulation system evaluation under accelerated stress, manufacturing process optimization reducing defect rates, design validation testing confirming performance specifications, and failure mode analysis understanding root cause mechanisms.
Reliable diagnostic results depend on proper testing procedures, equipment maintenance, and operator expertise.
Equipment Verification: daily calibration checks using certified standards, connection integrity inspection, ground reference validation, safety interlock functionality confirmation
Test Specimen Conditioning: ambient temperature stabilization (±5°C), moisture level documentation, previous test history review, visual inspection for obvious damage
Baseline Establishment: known-good reference waveform capture, multiple sample averaging for statistical validity, environmental condition recording, test parameter documentation
Voltage Selection: 2× rated voltage + 1000V for standard testing, progressive voltage ramping for weak insulation systems, voltage stress level consideration for component ratings, safety margin maintenance below destructive levels. The distinction between surge tester vs hipot tester becomes important when determining appropriate test voltages for specific applications.
Timing Considerations: sufficient capture duration for complete oscillation decay, sample rate adequate for frequency resolution, multiple shot averaging for repeatability, inter-test delay preventing thermal accumulation
Preserve measurement accuracy through regular maintenance: monthly calibration verification using certified standards, annual factory calibration maintaining traceability, connection hardware inspection preventing intermittent contacts, and software updates accessing latest analysis features. Understanding how to maintain and calibrate your digital surge tester ensures consistent, reliable diagnostic results over equipment lifespan.
Selecting appropriate waveform analysis capabilities requires matching equipment features to application requirements and technical sophistication.
Display and Visualization: high-resolution color screens for pattern clarity, multi-trace overlay capability, zoom and pan functions for detail examination, cursor measurements for quantitative analysis
Data Acquisition: minimum 1 MHz sample rate for motor applications, 12-bit or higher ADC resolution, dual-channel capability for simultaneous measurement, deep memory buffers capturing extended waveforms
Analysis Functions: automatic pass/fail determination with tolerance bands, phase comparison with deviation calculations, FFT spectrum analysis, historical data storage and trending
Different surge testing approaches offer varying waveform analysis capabilities — from traditional impulse testers with basic display and manual interpretation, through digital surge analyzers with automated defect recognition, up to integrated multi-function test systems with enterprise software integration. Whether a manual or automatic instrument fits your workflow better often comes down to throughput and documentation needs — see Manual vs Automatic Surge Tester: Which Is Right for You? for a side-by-side comparison. Understanding the difference between megger and surge test for windings also helps contextualize where waveform analysis provides unique value beyond complementary testing methods.
Match equipment capabilities to operational requirements:
Manufacturing Environment: automated testing integration, high-throughput capability, statistical reporting functions, network connectivity
Service Workshop: portable configuration, battery operation option, ruggedized construction, multi-voltage compatibility
Field Service: compact form factor, wireless data transfer, cloud-based reporting, intuitive user interface
Knowing how surge testing enhances motor reliability and efficiency justifies investment in advanced waveform analysis capabilities appropriate to your operational context. If your testing spans multiple voltage classes, Which Digital Surge Tester Do You Need? A Buyer’s Guide by KV Rating & Application maps out the right instrument tier for each.
Waveform analysis in surge testing is a diagnostic technique that examines the voltage patterns created when high-voltage pulses are applied to motor windings. The resulting oscilloscope-style traces reveal turn-to-turn faults, insulation weaknesses, and manufacturing defects by analyzing amplitude, frequency, and shape characteristics. This method detects defects at 90% accuracy compared to 60-70% with traditional pass-fail testing.
While basic surge testing provides simple pass/fail results, waveform analysis offers detailed visual patterns showing exactly where and how severe defects are. Standard testing might miss subtle turn-to-turn shorts or early insulation degradation, but waveform analysis captures these anomalies through pattern comparison, frequency shifts, and amplitude variations—enabling predictive maintenance rather than reactive repairs.
Surge testing is the process of applying high-voltage impulses to motor windings to stress-test insulation, while waveform analysis is the method of interpreting the resulting voltage patterns. Think of surge testing as the diagnostic procedure and waveform analysis as the interpretation tool—together they provide comprehensive electrical diagnostics beyond simple pass/fail results.
Yes, waveform analysis enables predictive maintenance by identifying early-stage degradation patterns. The technique detects insulation weakening at approximately 70% of breakdown voltage and can identify single-turn shorts before they cascade into catastrophic failures. Organizations using waveform trending report 40-60% reductions in unplanned downtime.
Effective waveform analysis requires a digital surge tester with high-resolution display, minimum 1 MHz sampling rate, multi-trace overlay capability, and data storage functions. Advanced systems include FFT spectrum analysis, automated comparison algorithms, and trending software. Entry-level equipment starts around $5,000, while comprehensive systems range from $15,000-$40,000.
Waveform analysis achieves 90% detection accuracy for turn-to-turn faults and identifies defects as small as single shorted turns—significantly outperforming resistance testing (60-70% accuracy) or basic hipot testing. When combined with other techniques like insulation resistance testing and vibration analysis, waveform analysis provides the most comprehensive motor diagnostics available.
Manufacturing sectors including automotive, aerospace, HVAC, renewable energy (wind turbines), and industrial motor production gain substantial benefits. Any industry relying on critical rotating equipment—from petrochemical plants to data centers—uses waveform analysis for quality control, predictive maintenance, and regulatory compliance. The technology is essential wherever motor failures result in costly downtime or safety hazards.
Waveform analysis in surge testing represents the pinnacle of electrical diagnostic technology, transforming invisible voltage patterns into precise, actionable intelligence about motor and winding condition. This sophisticated technique detects nascent failures at the earliest stages—long before conventional testing methods register anomalies—enabling predictive maintenance strategies that dramatically reduce downtime and extend equipment lifespan.
From manufacturing quality control to field service troubleshooting, waveform analysis delivers measurable benefits across diverse applications. The technology’s ability to visualize turn-to-turn faults, insulation degradation, and manufacturing defects provides diagnostic certainty that protects critical assets and optimizes operational efficiency.
As motor systems grow increasingly complex and operational demands intensify, adopting advanced waveform analysis capabilities transitions from competitive advantage to operational necessity. Organizations investing in proper equipment, training, and testing protocols position themselves to minimize unplanned failures, reduce maintenance costs, and maximize asset reliability.
Vivid Metrawatt Global delivers advanced surge testing solutions with intelligent waveform analysis designed for modern industrial applications. Strengthen your diagnostic capability with expert training, technical support, and application guidance to maximize the value of your testing investment.
⚡ Digital Surge Testing Equipment with advanced waveform analysis
⚙️ Professional motor diagnostic services for quality control & reliability
📊 Expert guidance to improve predictive maintenance programs