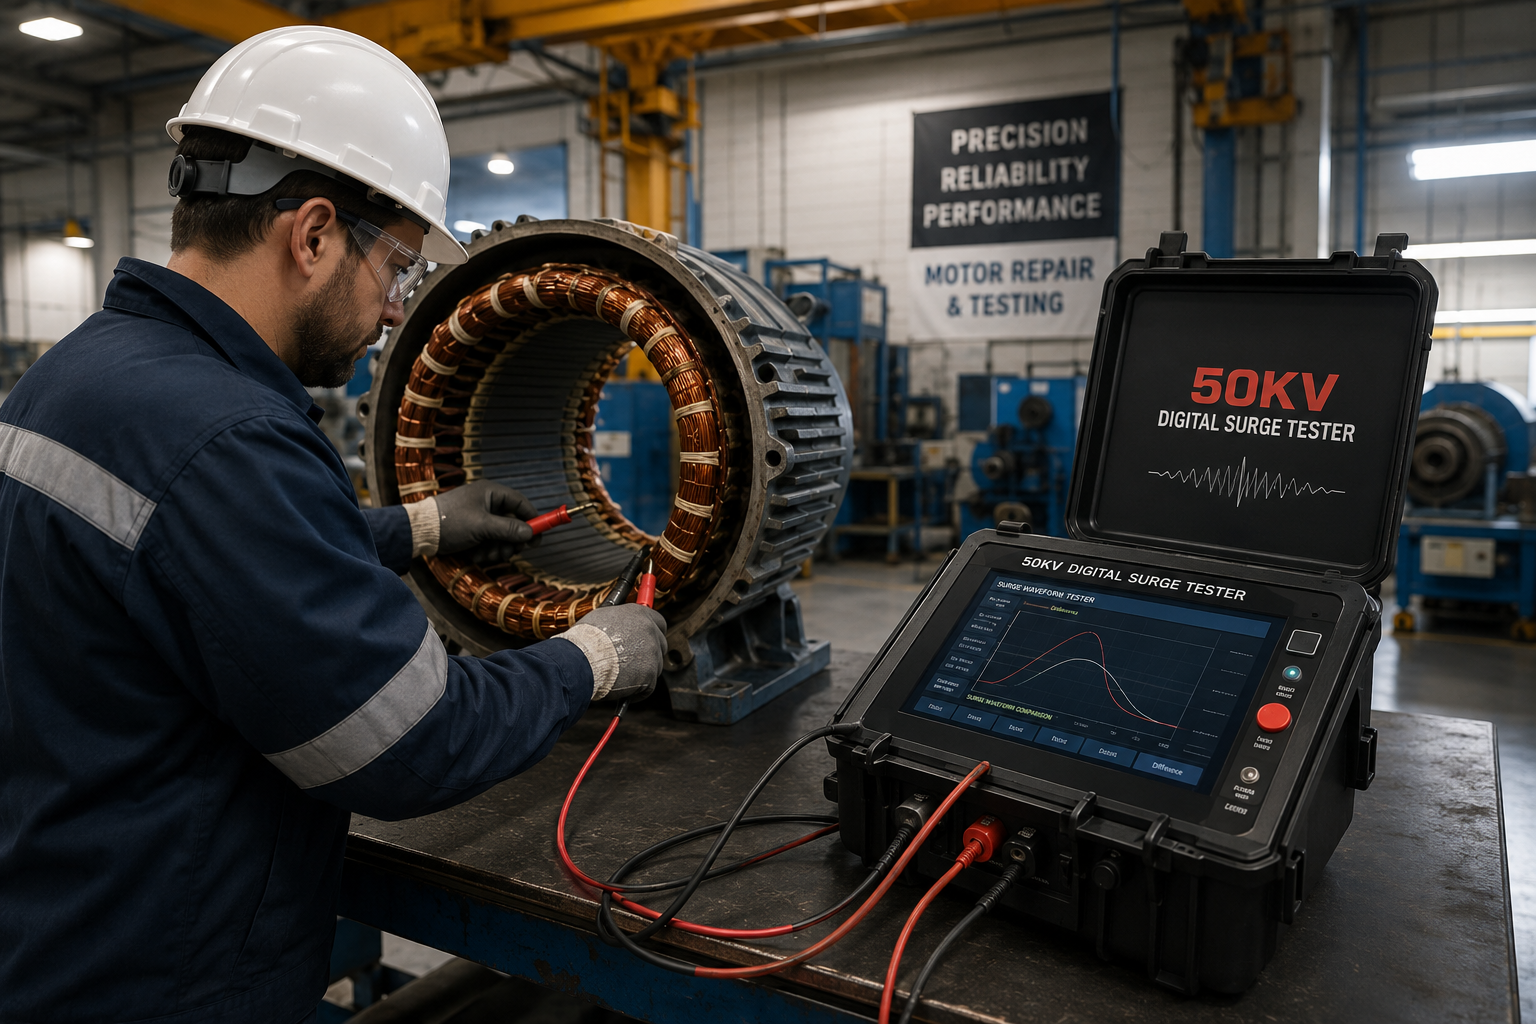
Motor winding faults cause 30-40% of all motor failures, yet traditional testing methods struggle to detect subtle turn-to-turn insulation weaknesses. Without quantifiable metrics, technicians rely on subjective visual waveform comparison, missing early warning signs of catastrophic failures. Error Area Ratio provides precise mathematical measurement of waveform differences, transforming surge testing from visual estimation into exact science with objective pass/fail criteria.
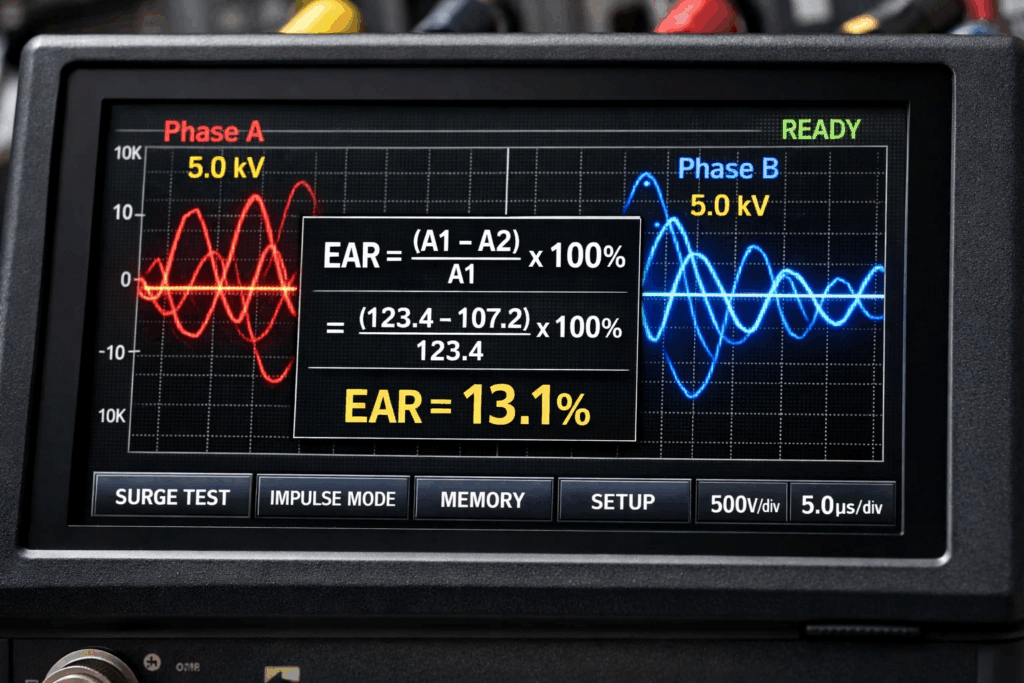
Error Area Ratio (EAR) in surge testing is a mathematical algorithm that quantifies the difference between two surge waveforms by calculating the area variance between them. When surge testers apply high-voltage impulses to motor windings, they generate characteristic oscillating waveforms that reveal insulation integrity.
The fundamental principle: Identical motor windings produce identical surge waveforms. Any deviation indicates potential faults—turn-to-turn shorts, ground faults, or insulation weaknesses. Rather than relying on visual comparison, EAR assigns a numerical percentage value representing waveform differences.
Also known as:
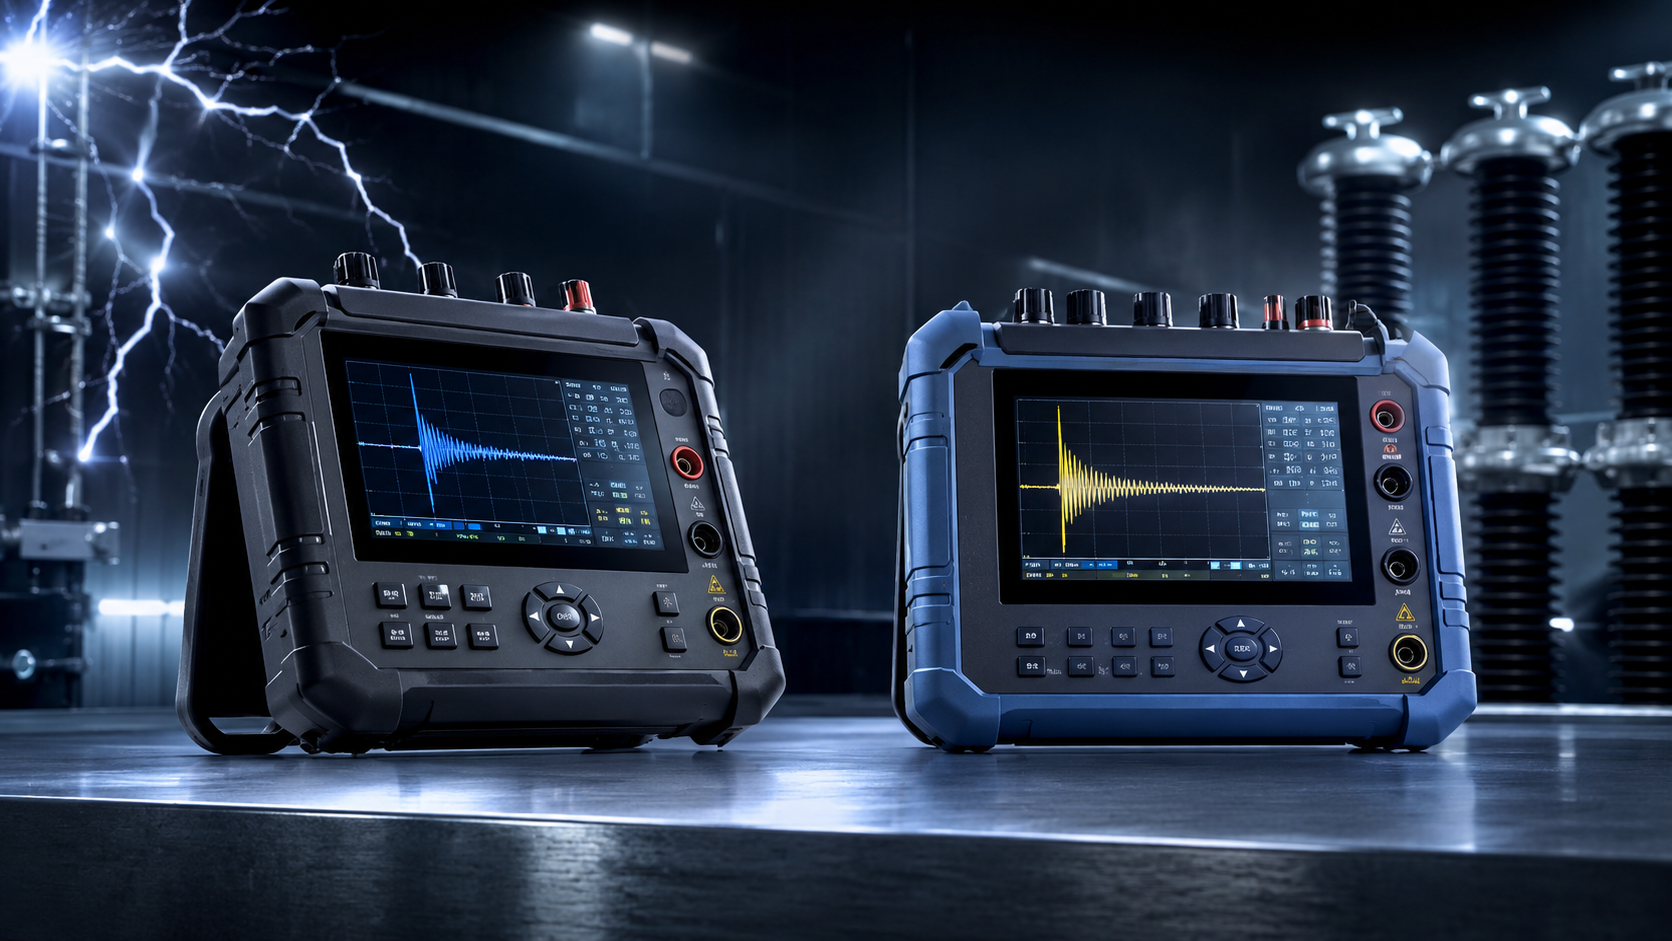
The surge test generates unique waveforms reflecting each winding’s electrical characteristics—inductance, capacitance, and resistance combined. These waveforms display as damped sinusoidal curves on digital surge tester screens. When comparing waveforms from different phases or successive pulses, EAR provides objective measurement eliminating human interpretation variability.
Why EAR matters: Experienced technicians might visually detect obvious waveform shifts, but EAR algorithms identify subtle changes invisible to human observation. These barely perceptible differences often indicate early-stage insulation degradation—the critical window for preventive maintenance before catastrophic failure.
Error Area Ratio calculation involves sophisticated mathematical comparison of waveform data points throughout the entire oscillation cycle:
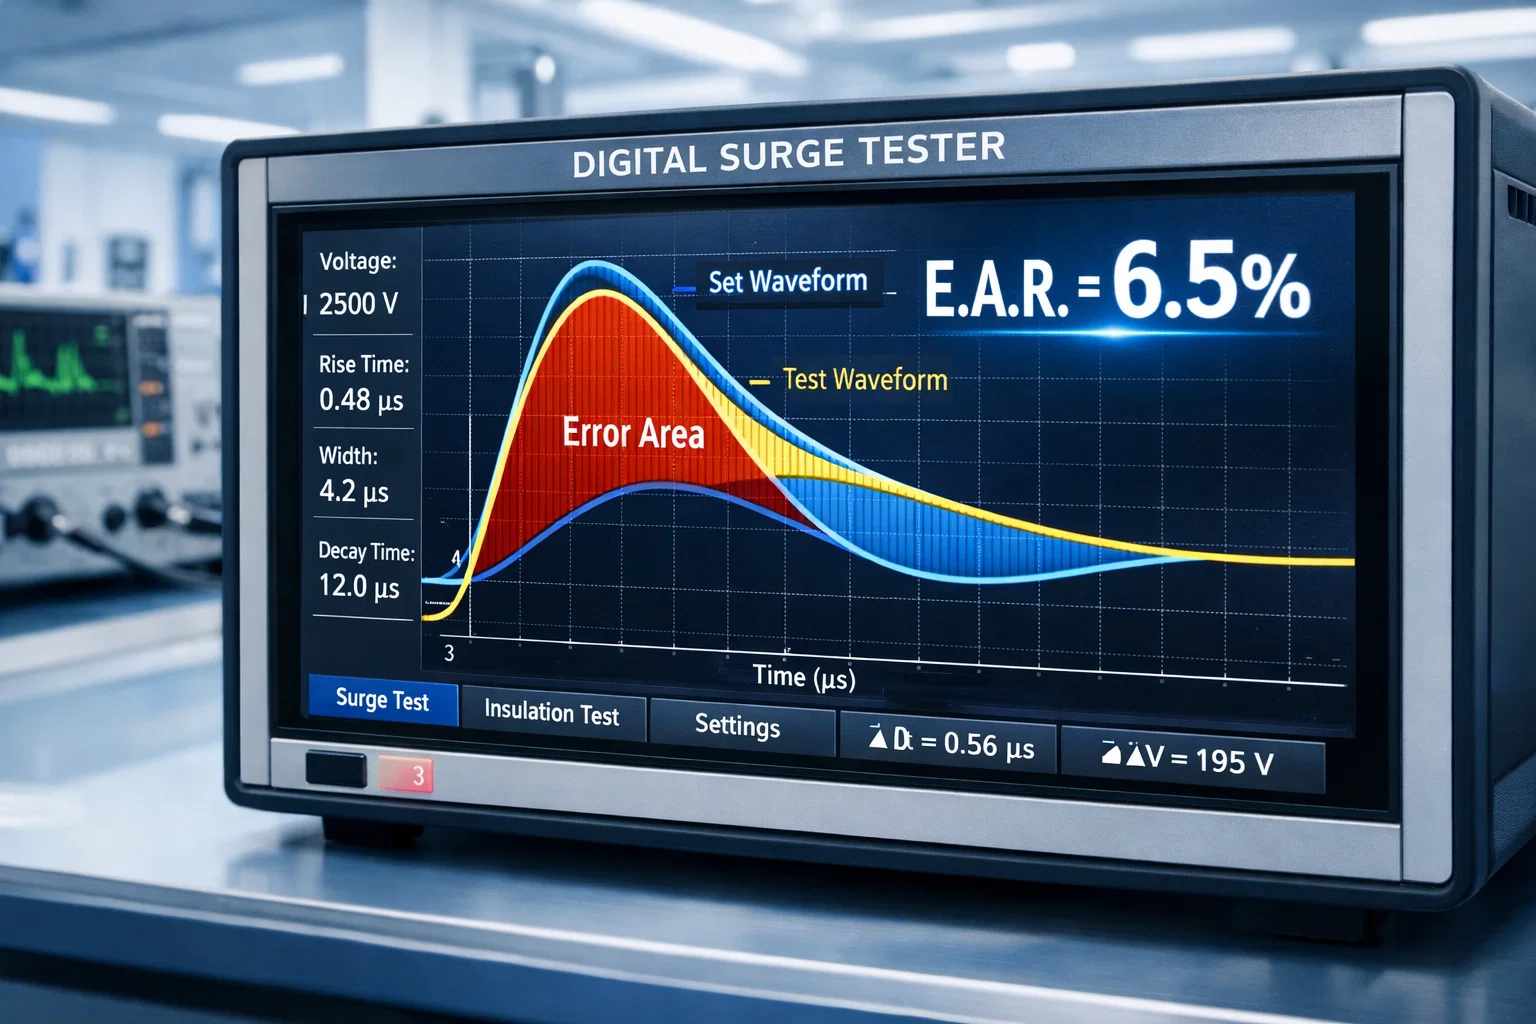
The EAR algorithm compares two waveforms point-by-point across their complete duration. At each time position along the x-axis, the algorithm measures the vertical difference between the two waveforms. These differences are accumulated and processed to generate the final EAR percentage.
Step-by-step process:
Different surge tester manufacturers implement variations of the EAR calculation, but the underlying approach remains consistent. The general formula involves comparing the area between two waveforms relative to a baseline measurement.
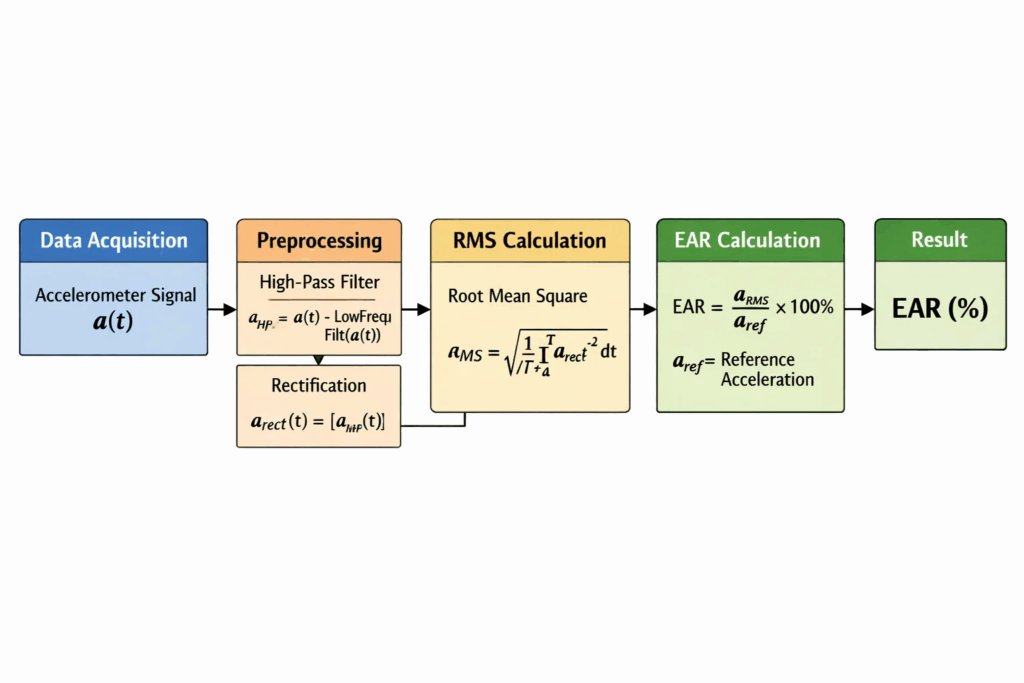
Root Mean Square (RMS) Method: Many modern testers use RMS equations for EAR calculation, providing mathematically robust measurement less susceptible to noise or isolated anomalies. This approach squares all individual point differences, averages them, and takes the square root—emphasizing consistent deviations over random spikes.
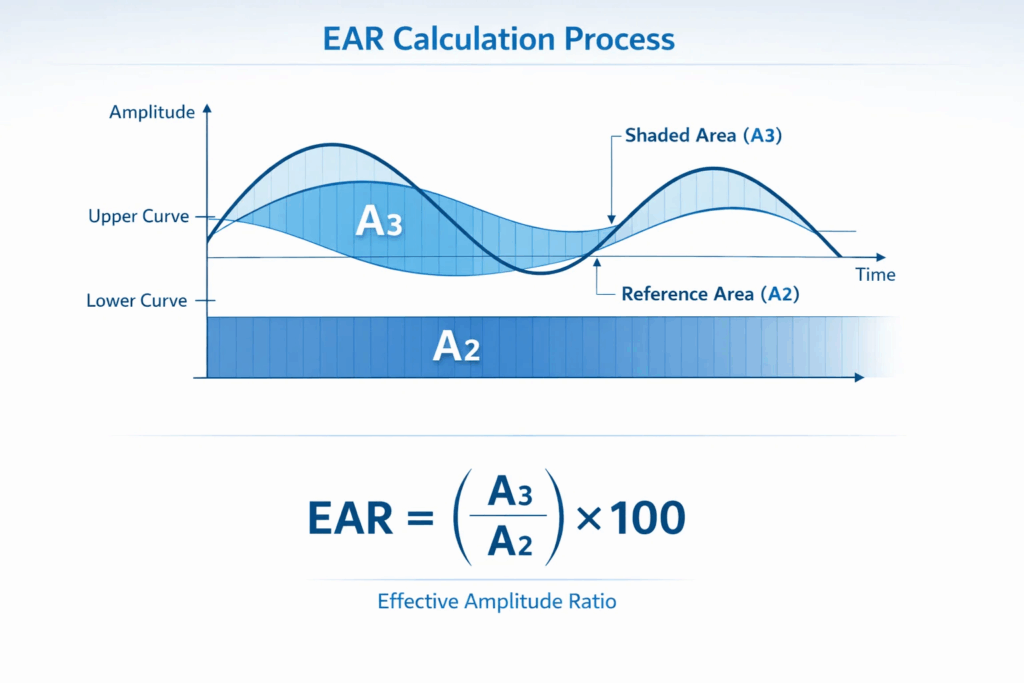
Area Ratio Method: This approach divides the absolute area between waveforms by the area under one reference waveform, expressing the result as percentage. If waveform areas are A2 and A3, where A3 represents the difference area, EAR = (A3/A2) × 100.
Understanding waveform analysis in surge testing helps maintenance professionals interpret EAR calculations and recognize patterns indicating specific fault types.
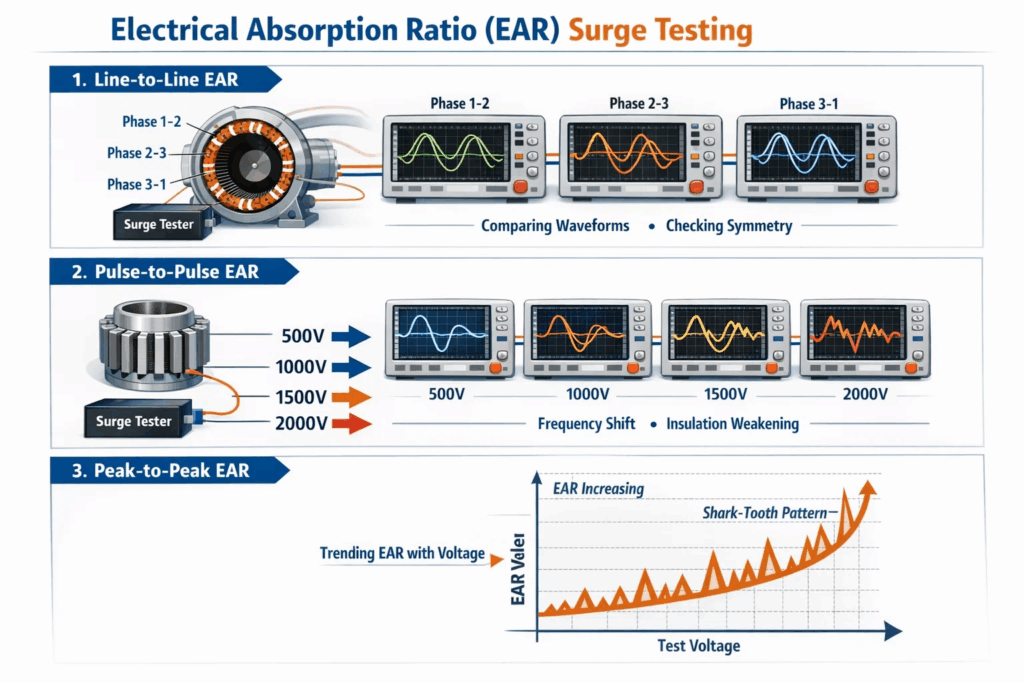
Surge testing employs multiple EAR methodologies, each targeting different fault detection scenarios:
Line-to-line EAR compares surge waveforms between different phases of three-phase motors. The assumption: electrically identical windings should produce virtually identical surge signatures.
How it works: The tester applies surge pulses to each motor phase separately, capturing complete waveforms. The system then calculates EAR between phase pairs: Phase 1-2, Phase 2-3, and Phase 3-1. Significant EAR values indicate asymmetry—potentially broken rotor bars, shorted turns, incorrect winding connections, or unbalanced turn counts.
Limitations: L-L EAR works exceptionally well for motors tested without rotors installed, where coil geometry remains perfectly balanced. However, assembled motors (with rotors) introduce natural asymmetries from rotor position effects, magnetic coupling variations, and rotor bar influences. These factors can generate false positives, making L-L EAR interpretation more complex for complete motors.
Best applications:
Pulse-to-pulse EAR revolutionized insulation diagnostics by detecting progressive waveform changes as test voltage increases. Rather than comparing different phases, P-P EAR analyzes successive pulses at incrementally higher voltages applied to the same winding.
Testing sequence: Start at operating voltage, then increase test voltage in consistent steps (typically 500V increments) up to the recommended maximum. At each voltage level, capture the surge waveform and calculate EAR compared to the previous lower-voltage waveform.
Detection principle: Healthy insulation maintains consistent waveform shape across all voltage levels, producing minimal EAR values. Weak insulation, however, begins arcing at specific voltage thresholds. This arcing momentarily reduces winding inductance, shifting the waveform frequency and creating measurable EAR increases.
Advantages:
Also called pulse-to-pulse EAR or ppEAR, this method creates trending graphs showing EAR progression across voltage increases. The visual representation helps identify characteristic “shark tooth” patterns or sudden EAR jumps indicating insulation arcing.
Regular motor winding testing combined with EAR analysis provides comprehensive diagnostic coverage identifying both immediate faults and developing weaknesses.
Interpreting EAR percentages requires understanding both numerical thresholds and contextual factors influencing measurements:
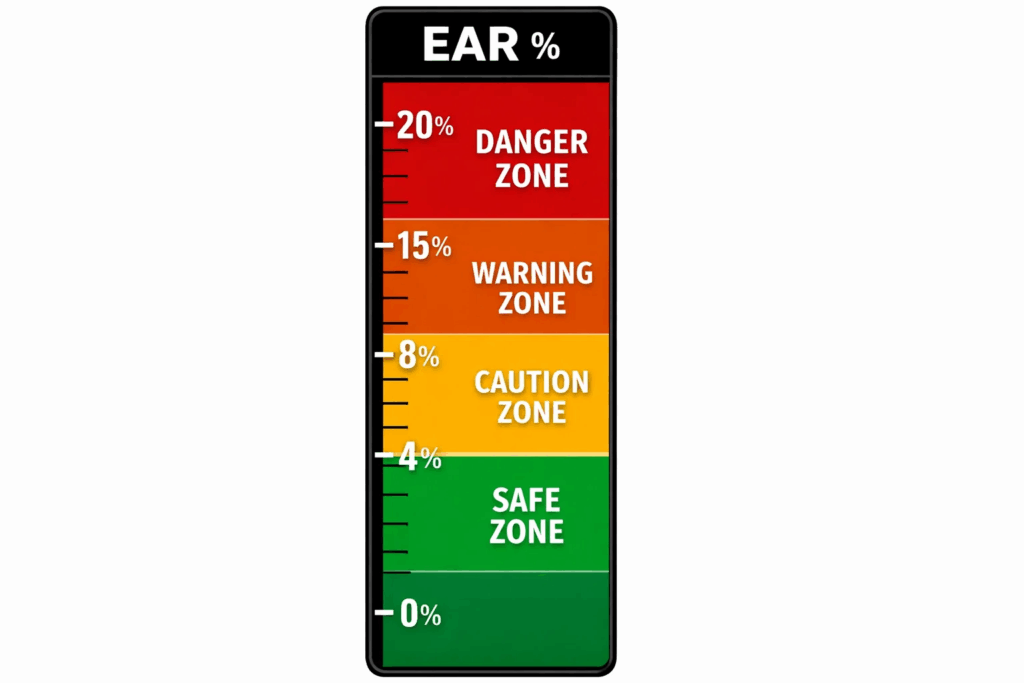
0-2% EAR: Essentially identical waveforms. This range indicates excellent winding symmetry with no detectable faults. Minor variations within this range typically result from measurement noise or insignificant manufacturing tolerances.
2-4% EAR: Slight differences barely visible to human eye. This range warrants attention but doesn’t necessarily indicate faults. Could represent normal variations in assembled motors or minor geometric differences in hand-wound coils.
4-8% EAR: Noticeable waveform differences requiring investigation. This range often indicates developing issues—minor insulation degradation, small turn count variations, or connection resistance differences. Consider trending tests to monitor progression.
8-15% EAR: Significant waveform deviation clearly visible on display. Likely indicates definite problems: turn-to-turn shorts, ground insulation weaknesses, or serious manufacturing defects. Equipment should undergo detailed inspection before operation.
Above 15% EAR: Major fault confirmed. Waveforms show substantial shape differences indicating severe insulation failure, multiple shorted turns, or critical defects. Equipment typically fails quality control or requires immediate repair.
Absolute EAR values provide starting points, but experienced technicians adjust interpretation based on:
Motor type and construction: Concentric wound stators naturally exhibit higher phase-to-phase EAR than lap wound designs. Form-wound coils show tighter tolerances than random-wound configurations.
Testing method: L-L EAR typically shows higher baseline values than P-P EAR for the same motor. Assembled motors generate higher L-L EAR than bare stators.
Voltage level: Higher test voltages naturally increase EAR in healthy motors because waveform characteristics shift with voltage changes. P-P EAR accounts for expected voltage-dependent increases.
Motor size and voltage rating: Large motors often show slightly higher EAR values than fractional horsepower machines due to increased winding complexity and longer connection paths.
Understanding these nuances helps avoid false positives while catching genuine motor winding failure signs before catastrophic breakdowns occur.
Selecting appropriate EAR testing method depends on motor condition, testing objectives, and equipment configuration:
Ideal scenarios:
Advantages: Quickly identifies gross manufacturing defects, incorrect connections, phase imbalances, and major insulation failures. Single test voltage provides rapid screening.
Limitations: Less effective for assembled motors due to rotor magnetic asymmetries. Cannot reliably detect progressive insulation degradation developing at elevated voltages.
Ideal scenarios:
Advantages: Eliminates rotor influence and phase construction differences. Detects voltage-dependent insulation breakdown—the most common failure precursor. Provides trending data showing degradation progression.
Limitations: Requires multiple voltage steps, extending test duration. Demands careful voltage selection and increment planning.
Complementary Approach: Many facilities perform initial L-L EAR screening followed by P-P EAR investigation when initial results show suspicious patterns. This two-stage approach optimizes testing efficiency while maximizing fault detection probability.
Combining EAR analysis with surge tester vs hipot tester understanding helps maintenance teams select appropriate testing strategies for comprehensive motor evaluation.
Modern digital surge testers implement sophisticated algorithms optimizing EAR accuracy and reliability:
Root Mean Square calculation methods provide mathematically rigorous waveform comparison resistant to measurement artifacts:
Process: Square the difference between waveforms at each data point, calculate the mean of all squared differences, and extract the square root. This approach emphasizes consistent deviations while minimizing single-point anomalies’ impact.
Advantages: Superior noise rejection, mathematically well-defined, consistent results across different waveform shapes, and alignment with standard statistical analysis practices.
Direct area calculation compares the absolute area between waveforms:
Process: Calculate the cumulative area between two waveforms throughout the entire oscillation cycle. Normalize this difference area by dividing by the reference waveform area, expressing the result as percentage.
Advantages: Intuitive visual correlation—larger visible gaps produce higher EAR values. Effective for identifying frequency shifts and amplitude changes simultaneously.
Leading manufacturers develop proprietary algorithms incorporating multiple calculation methods, adaptive filtering, and pattern recognition:
Zero-Crossing Detection: Supplements EAR with frequency shift identification. Arcing insulation reduces winding inductance, increasing oscillation frequency and shifting zero-crossing positions leftward.
Amplitude Weighting: Advanced algorithms apply greater emphasis to waveform differences occurring during peak amplitude oscillations where insulation stress concentrates.
Trend Analysis Integration: Sophisticated systems automatically compare current EAR values against historical baselines, flagging anomalous increases suggesting accelerating degradation.
Understanding how surge generators work provides context for appreciating the precise timing and voltage control required for accurate EAR calculations.
Successful fault diagnosis requires combining EAR numerical values with waveform visualization and operational context:
Always review actual waveforms alongside EAR percentages. The visual comparison reveals fault nature—frequency shifts indicate turn shorts, amplitude changes suggest ground leakage, damping differences point to resistance variations.
Frequency Shifts: Waveforms separate horizontally with zero-crossings misaligned. Indicates reduced inductance from shorted turns. Higher frequency waveform represents the faulted phase.
Amplitude Changes: Waveforms maintain similar frequency but different peak voltages. Suggests capacitance variations or partial grounding reducing oscillation amplitude.
Damping Differences: One waveform decays faster than the other. Points to resistance imbalances from poor connections or conductor damage.
Single EAR measurements provide snapshots, but trending reveals degradation progression:
Stable EAR: Consistent values across multiple test sessions indicate either healthy windings or stable chronic issues not progressing toward failure.
Gradually Increasing EAR: Progressive rises over weeks or months signal active insulation deterioration. Establish more frequent monitoring and plan preventive maintenance.
Sudden EAR Jumps: Dramatic increases between consecutive tests suggest acute insulation damage from recent events—voltage transients, thermal stress, or mechanical impacts.
Integrate EAR results with complementary diagnostics:
Comprehensive troubleshooting of surge tester errors ensures measurement accuracy and prevents misdiagnosis based on equipment problems rather than winding faults.
Multiple variables influence EAR measurements beyond actual winding condition:
Sampling Rate: Higher data acquisition rates capture waveform details more accurately. Insufficient sampling can miss rapid oscillations affecting EAR calculations.
Voltage Stability: Inconsistent surge voltage levels between pulses introduce artificial EAR variations. Quality surge generators maintain precise voltage regulation.
Probe Connection Quality: Poor electrical contact at test points adds resistance and capacitance, distorting waveforms. Clean, secure connections ensure measurement integrity.
Calibration Status: Regular tester calibration maintains measurement accuracy. Drift in voltage scaling or timing circuits compromises EAR reliability.
Temperature: Winding resistance increases with temperature, affecting waveform damping characteristics. Test at consistent temperatures or apply temperature corrections.
Humidity: Excessive moisture can create surface leakage paths altering apparent insulation quality. Control testing environment or document conditions.
Electromagnetic Interference: High-current operations nearby can induce noise into sensitive measurement circuits. Shield test areas or schedule testing during quiet operational periods.
Rotor Position: In assembled motors, rotor bar alignment relative to stator poles affects magnetic coupling and waveform shape. L-L EAR shows variation with rotor rotation; P-P EAR remains largely unaffected.
Core Saturation: Very high test voltages can saturate iron cores, nonlinearly affecting inductance. Follow manufacturer voltage recommendations avoiding excessive levels.
Winding Configuration: Delta connections show different waveform characteristics than wye configurations. Parallel circuits complicate interpretation compared to series windings.
Avoiding common pitfalls while identifying genuine surge tester insulation failures requires systematic testing protocols accounting for these variables.

Maximize EAR testing effectiveness through standardized procedures and proper technique:
Document Baseline Conditions:
Verify Equipment Operation:
Prepare Test Environment:
For Line-to-Line EAR:
For Pulse-to-Pulse EAR:
Maintain Comprehensive Records:
Establish Baselines: Test new or recently rewound motors establishing “healthy” reference signatures. Compare subsequent tests against these baselines detecting degradation.
Schedule Regular Testing: Implement predictive maintenance programs with consistent testing intervals. Critical motors warrant more frequent evaluation than ancillary equipment.
Understanding the full range of applications of digital surge testers helps maintenance teams integrate EAR testing into comprehensive equipment reliability programs.
Avoid these frequent errors compromising EAR diagnostic accuracy:
Mistake #1: Absolute Threshold Reliance
Rigidly applying universal pass/fail EAR percentages without considering motor type, construction, and test method. A 5% L-L EAR might indicate failure in a lap-wound motor but represent normal variation in concentric wound designs.
Solution: Develop motor-specific acceptance criteria based on construction type, establish baseline references for motor families, and trend individual motor EAR over service life.
Mistake #2: Ignoring Waveform Appearance
Focusing exclusively on EAR numerical values while neglecting visual waveform inspection. Two motors with identical 8% EAR might show completely different waveform patterns indicating distinct fault mechanisms.
Solution: Always review waveforms alongside EAR values. Analyze frequency shifts, amplitude variations, and damping characteristics providing fault type insights.
Mistake #3: Single Test Conclusions
Making critical maintenance decisions based on isolated EAR measurements without trending context or confirming tests.
Solution: Conduct multiple tests establishing measurement repeatability. Compare against historical data confirming genuine changes versus measurement variability.
Mistake #4: Inadequate Test Preparation
Testing motors without proper disconnection, energy discharge, or connection verification leading to personnel hazards and measurement errors.
Solution: Implement comprehensive lockout/tagout procedures. Verify isolation with voltage testers before connecting surge equipment. Follow manufacturer safety protocols rigorously.
Mistake #5: Incorrect Voltage Selection
Applying excessive test voltages damaging weakened insulation or insufficient voltages failing to stress insulation revealing incipient faults.
Solution: Follow industry standards (IEEE, IEC) for test voltage selection based on motor rating and application. Consult motor manufacturer recommendations when available.
Mistake #6: Poor Connection Quality
Loose or corroded test connections introducing resistance and capacitance distorting waveforms and inflating EAR values.
Solution: Clean terminal surfaces before testing. Use properly sized connection hardware. Verify secure mechanical contact. Document connection configuration preventing phase misidentification.
Learning from mistakes while understanding the comprehensive benefits of using surge testers accelerates maintenance team proficiency in EAR-based diagnostics.
EAR interpretation depends on testing method and motor configuration. For Line-to-Line EAR, values exceeding 10-15% typically indicate definite problems requiring investigation. For Pulse-to-Pulse EAR, focus on trends rather than absolute values—sudden increases above expected voltage-dependent rise suggest insulation arcing. Always combine EAR values with waveform visual inspection and consider motor construction before declaring failure.
Properly conducted EAR testing does not damage motor windings. Surge test voltages exceed operating levels but remain far below insulation design ratings. The brief, low-energy pulses cannot puncture healthy insulation. Modern digital surge testers include automatic shutoff immediately upon detecting arcing, limiting arc repetition preventing damage. Millions of surge tests conducted over decades confirm non-destructive nature when following proper procedures and voltage guidelines.
EAR and zero-crossing detection are complementary surge test analysis methods. Zero-crossing detects frequency shifts by measuring waveform timing—insulation failures reduce inductance, increasing oscillation frequency and shifting zero-crossing positions leftward. EAR quantifies overall waveform shape differences including frequency, amplitude, and damping variations. Many modern surge testers employ both methods zero-crossing identifies frequency-based faults while EAR captures comprehensive waveform changes.
High EAR in new motors typically indicates manufacturing quality issues rather than insulation degradation. Common causes include unbalanced turn counts between phases, incorrect internal connections, reversed coil groups, varying wire gauge, or improper winding distribution. Some motor designs inherently show higher EAR due to construction geometry concentric wound stators naturally exhibit greater phase-to-phase differences than lap wound configurations. Establish acceptance criteria appropriate to specific motor construction.
Testing frequency depends on motor criticality and operating conditions. Critical motors affecting production or safety warrant quarterly or semi-annual EAR testing as part of predictive maintenance programs. Standard motors may receive annual testing during scheduled maintenance outages. Motors exposed to harsh environments—high temperatures, voltage transients, frequent starts—benefit from more frequent evaluation. After initial baseline testing, trend analysis indicates whether intervals should be shortened or extended based on degradation rate.
Error Area Ratio transforms surge testing from subjective art into quantitative science, providing maintenance professionals with objective metrics for motor insulation condition assessment. By mathematically comparing surge waveforms, EAR identifies developing faults weeks or months before catastrophic failures, enabling scheduled repairs during planned outages rather than emergency responses to unexpected breakdowns.
The evolution from simple waveform comparison to sophisticated EAR calculation represents a fundamental advancement in predictive maintenance capabilities. Line-to-Line EAR efficiently screens for manufacturing defects and gross asymmetries, while Pulse-to-Pulse EAR detects progressive insulation degradation at elevated voltages—the critical failure precursor most maintenance strategies must identify.
Success with EAR testing requires understanding both the mathematical foundations and practical implementation factors. Proper equipment operation, consistent testing procedures, comprehensive documentation, and integration with complementary diagnostic methods maximize the value extracted from EAR analysis. Avoiding common interpretation errors while accounting for motor-specific variables ensures accurate fault identification and appropriate maintenance responses.
For maintenance teams committed to minimizing unplanned downtime through condition-based strategies, mastering EAR interpretation provides essential capability. When combined with thermal imaging, vibration analysis, and oil analysis, EAR-based surge testing creates comprehensive equipment health monitoring identifying problems early enough for cost-effective intervention.
Contact Vivid Metrawatt Global to explore digital surge testing solutions designed for precise motor diagnostic capability, early fault detection, and long-term equipment reliability across industrial applications.